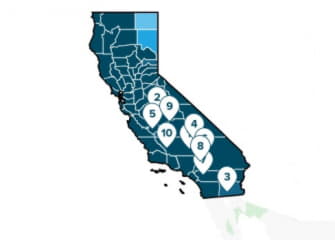
Methodology
To find the most affordable places to buy a home, SmartAsset considered closing costs, real estate taxes, homeowners insurance and mortgage rates in the analysis.
We started the analysis by including all cities with a population of 5,000 or greater. We then measured the total cost of owning a home (using the average home cost) in each city over a five-year period. That five-year cost was then measured as a proportion of median household income in each place to determine affordability.
The most affordable places were those in which total housing costs were smallest compared to the median income in each area. Each city was then indexed on a scale from 0 to 100, with the most affordable location receiving a score of 100.
| Rank | City | Avg. Closing Costs | Annual Property Tax | Annual Homeowner's Insurance | Avg. Annual Mortgage Payment | Median Income | Affordability Index |
| 1 | California City, CA | $2,223 | $1,170 | $220 | $5,755 | $48,238 | 50.01 |
| 2 | Madera Acres, CA | $2,716 | $1,426 | $429 | $11,219 | $85,558 | 49.39 |
| 3 | Imperial, CA | $2,741 | $2,132 | $441 | $11,535 | $85,876 | 45.76 |
| 4 | Ridgecrest, CA | $2,460 | $1,720 | $335 | $8,780 | $65,077 | 44.77 |
| 5 | Coalinga, CA | $2,434 | $1,465 | $323 | $8,449 | $61,026 | 44.31 |
| 6 | Barstow, CA | $2,200 | $889 | $208 | $5,454 | $39,585 | 44.06 |
| 7 | Homeland, CA | $2,250 | $1,010 | $233 | $6,091 | $42,239 | 42.05 |
| 8 | Spring Valley Lake, CA | $2,934 | $2,667 | $535 | $14,010 | $95,426 | 41.49 |
| 9 | Orosi, CA | $2,311 | $1,125 | $262 | $6,870 | $44,756 | 39.52 |
| 10 | Taft, CA | $2,377 | $2,065 | $295 | $7,720 | $53,574 | 39.03 |
| CA | $3,141 | $3,031 | $753 | $19,725 | $71,228 |
READ FULL ARTICLE HERE


